SPM 2010
6. Diagram 6.1 shows the location of the pituitary
gland in a human.

· It is a ductless gland because it secretes
hormones directly into the bloodstream rather than through a duct.
· It
is the master gland because it controls the production and secretion of
hormones by other endocrine glands.
(ii)
Explain the role
of the pituitary gland in regulating the blood osmotic pressure when the intake
of water is too little.
- When
the intake of water is too little, the blood osmotic pressure increases,
the osmoreceptors detect the change in the blood osmotic pressure and send
nerve impulses to the hypothalamus.
- The
hypothalamus riggers the pituitary gland to secrete the antidiuretic
hormone (ADH) into the bloodstream.
- ADH
causes the distal tubule and the collecting duct to become more permeable
to water.
- Therefore,
more water is reabsorbed into the blood.
- As a result, the urine that has been discharged from the kidneys becomes more concentrated and the blood osmotic pressure returns to normal.
(b) Diagram 6.2 shows the
transmission of a nerve impulse from neurone P to neurone R.
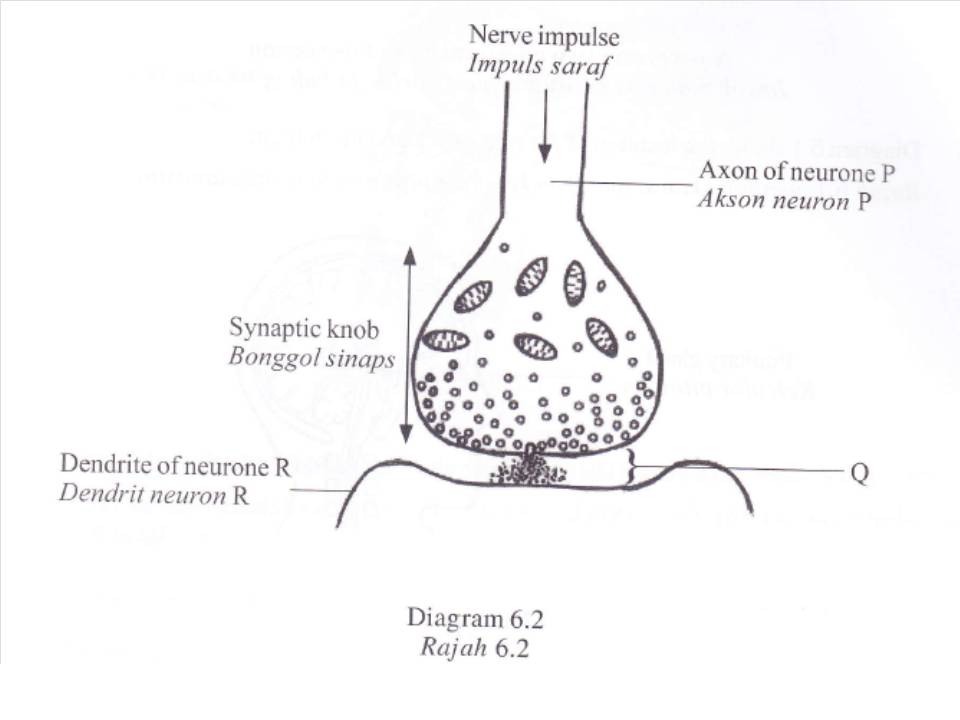
Explain the transmission of a nerve impulse from
neurone P to neurone R across Q.
- An
impulse from neurone P (afferent neurone) is in the form of electrical
signals or nerve impulse.
- The
nerve impulse arrives at the axon terminal (presynaptic) of neurone P.
- This
causes the synaptic vesicles to move towards the presynaptic membrane and fuse with the membrane.
- Neurotransmitters
(eg acetylcoline) molecules are released from the synaptic vesicles.
- The
neurotransmitter molecules diffuse across the synaptic cleft into the
postsynaptic knob (dendrite) of neurone R.
- The
neurotransmitter molecules bind to specific receptor sites in the post
synaptic knob.
- The
binding generates a new nerve impulse.
- The
impulse then moves along the pastsynaptic neurone.
- The release of
neurotransmitters is in one direction, from the synaptic knob to the post
synaptic neurone.
Plan and design and experiment to determine the effect of drinking different volumes of water on the volume of urine released.
1.Aim:
To determine the effect of drinking different volume of water on the volume of urine released.
2.Problem Statement:
What is the effect of drinking different volumes water on the volume of urine released?
3.Variables:
Manipulated variable : volume of water intake
Responding variable : volume of urine released
Fixed variable : same student/same environment/ time
4.Hypothesis:
The higher the volume of water intake, the higher the volume of urine released.
5.Materials : Boy/girl/student, water
Apparatus : Beakers, glass/cup/mug, measuring cylinder, stop watch
6.Technique:
Measure and record the volume of urine released (after a fixed hour of consuming water) by using a measuring cylinder.
7.Procedure:
1.
|
A student (Sample A) is chosen and instructed to empty his bladder before the start of the experiment
|
2.
|
Measure 200ml of water and put it into the mug/cup/glass.
|
3
|
A student (Sample A) is given 200ml of water to drink.
|
4
|
A stop watch is started immediately after consuming the water.
|
5
|
During the experiment, he is kept in (any fixed suitable room) within 2 hours (any suitable time range).
|
6
|
He is instructed not to eat or perform any vigorous physical activities (within the given time).
|
7
|
After 2 hour, the stop watch is stopped and he is asked to empty his bladder.
|
8
|
The volume of urine collected is measured and recorded.
|
9
|
Steps 2 – 8 is repeated for different amount of water drank (400 ml, 600ml, 800ml).
|
12
|
The whole experiment is repeated using 2 different students to get a more accurate result.
|
13
|
Dispose the measured urine properly
|
14
|
Measure and record data collected into a table. Graph of urine output against the water intake is plotted.
|
15
|
Precaution : Student is instructed not to eat or perform any vigorous physical activities during the experiment.
|
8. Results/ data:
Volume of water intake (ml)
|
Volume of urine released (ml)
| |||
Student
A
|
Student
B
|
Student
C
|
Average
| |
200
| ||||
400
| ||||
600
| ||||
800
| ||||
9.Conclusion:
The higher the volume of water intake, the higher the volume of urine released. Hypothesis is accepted.
No comments:
Post a Comment